BUILT FOR CFO
Budget Reports

Quantify Your Experience ROI
in Minutes, Not Months

Turn CX and EX into board-ready ROI, stage-by-stage across the customer journey. See what’s at risk, what’s recoverable, and where to focus next.

Most CX leaders are doing the work. The problem is the board can’t see it in numbers they trust.
Start understanding your business
in the next 5 minutes.
Sample data, take a look at example industry snapshots.
Walk-through the ROI Engine guide at your own pace what the this tool is for.
Have an expert guide you to present correct figures at the next board meeting

What is our ROI Engine?
It’s an innovative system of measuring Success!

Our ROI Engine is a board-ready analytics tool that translates Customer Experience and Employee Experience into commercial impact.

86%

of your product buyers are willing to pay more for a great customer experience – PWC

73%

of companies with above-average CX perform better financially than competitors – Forrester Research

32%

of customers leave a brand they’ve loved after just one bad experience – PWC Future of CX

Flipping the CX Script: From Operational Proof to Strategic Impact

The Customer Journey is the universal truth that connects all departments.

The Perspective Shift

From proving ROI at the Operational level to demonstrating impact at the Strategic level.

Old Perspective

  • NPS, CSAT, CES as outcomes
  • Uphill battle for ROI
  • Operational Focus

New Perspective

  • Metrics as outcome drivers
  • Strategic impact first
  • Top-down approach

Dashboard Views
That Drive Board Conversations

Visualising the Financial Impact of Experience

Value at Risk

Instant Visibility

Scenario Planning

Model the Impact

Journey Funnel

Pinpoint the Leakage

Why do I need the ROI Engine?
Our ROI Engine Fixes the CX Measurement Problem

Our ROI Engine highlights gaps in your Customer Experience and Employee Experience journeys with clear and fact based visuals.

How our ROI Engine Works
In 4 Simple Steps

From Data to Board-Ready Narrative

1

Customer
Counts
 
Input volumes
& CLV.

2

Quantify
Leakage
 
Translate drop-off to money.

3

Scenario
Plan
 
Apply uplift assumptions.

4

Operational
Levers
 
Connect drivers
to financial story.

“Revenue at Risk”

See the revenue that is at risk across your entire customer base.

“Recoverable Value”

Start Recovering your value through targeted science backed improvements.

“Laser Focused Journeys”

Focus your journey at the points of highest commercial impact.

Transparent Maths.
No Mystery.

Finance trust comes from clarity.

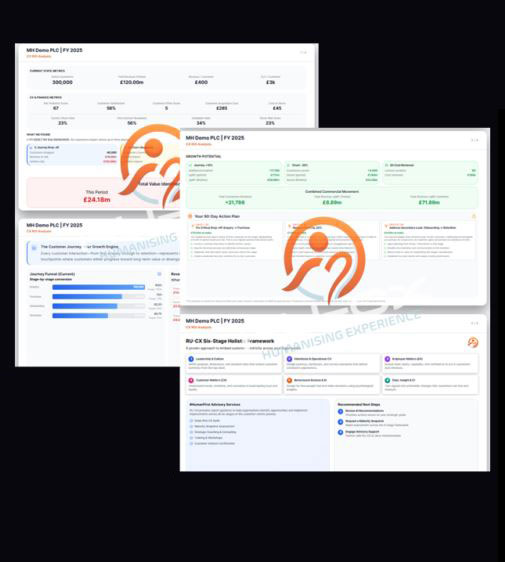
  • Period vs lifetime CLV
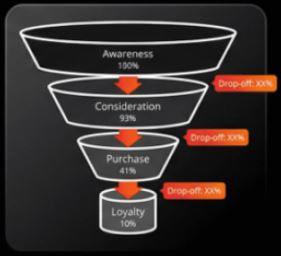
  • Stage-by-stage leakage
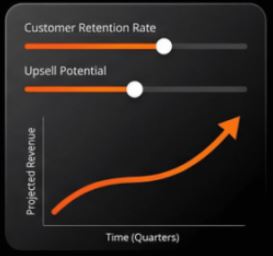
  • Scenario uplift compounds
  • Churn separate from drop-off
  • Assumptions are editable and visible

Your Data is Protected

  • No-one has access except you

  • Our team is only allowed has access if you authorise.

  • Your assessments are visible only to you.

  • Fully encrypted storage.

The methodology is designed to survive CFO scrutiny. Every calculation is transparent, every assumption is editable, and the logic is sound.

No Black Boxes. No Magic numbers. Just clear commercial logic that connects experience metrics to revenue outcomes.

The Entire Leadership Team
Has a Single source of Truth

Made for cross-functional alignment, not another dashboard that gets ignored.

For CX Leaders

Protect budgets and prove the value of experience investments with commercial evidence the board can’t ignore.

For Marketing & Growth

See exactly where customers leak from your funnel and what it’s costing
you.

For Ops & Service

Prioritise and identify operational friction points that drain resources and damage retention.

For Finance & Board

Validate assumptions with a
transparent methodology and a clear line of sight to revenue.

Turn Customer Experience Into Evidence
your board will fund

Our RU-CX ROI Engine reveals where customers leak, howmuch revenue is at risk, and what you recover when you fix it – with transparent maths CFO’s trust.

Start understanding your business
in the next 5 minutes.
Sample data, take a look at example industry snapshots.
Walk-through the ROI Engine guide at your own pace what the this tool is for.
Have an expert guide you to present correct figures at the next board meeting

Pricing Options – Try it for FREE !

Secure payment powered by Stripe. Cancel anytime after 12 months for subscriptions.

Free Trial

Free On-Screen Analysis
£ 0 Annually
  • On Screen Visuals
  • One Free Assessment
  • Two Scenario Visuals
  • Maturity Snapshot
  • Industry Insights
  • View Dashboard
  • View Board Report
Free Trial

Member

Half Price Offer - Most Popular
£4999
£ 2388 Annually
  • Full Access
  • Multiple Assessments
  • Unlimited Scenarios
  • 8 Annual PDF Report Exports
  • 8 Annual PPT Report Exports
  • YoY, H1 H2, Quartley Reporting
  • AI Insights Recommendations
  • Tailored Journey Funnels
£199 monthly

Enterprise

Custom Access
£ Custom Annually
  • Everything in Paid Membership
  • Maturity Assessment Report
  • Segmented Insights
  • Market Research Reports
  • Benchmark Reports
  • Multi-user Access
  • Roll Based Visuals
  • Hands on Expert
  • Premium Support
  • More...

Organisations have used ROI to highlight gaps that are hemorrhaging  millions, and provided solutions that have saved CEO’s millions in Return.